Tuesday, December 18, 2007

Historical Stock EOD Downloader (from Yahoo finance)

Hello All,

I know most of the people are intested in having historical data of a specific stock (or all stocks) for analysis. So here comes a handy easy-to-use tool which can be used to download the Historical EOD of all the available stocks in the NSE. The downloaded data (in .csv format) is compatible with Metastock, Amibroker, AdvancedGET etc.

This tiny software also displays the last 5 days graph (line graph) for a selected stock. It is developed using C# language so .NET framework should be installed in the machine. Click here to download .NET framework from Microsoft.

No trail version... no subscribtion charges :) Its just free....

as usual I will provide the source code also for the intested people . Download the software from

http://manjunathg.com/Softwares/YahooEODDownloader.zip

****NOTE: Please check the bottom of this page for the latest updates *****

Usage and screenshots are as follows.


This is the first screen what you get when you open the application. You can see that the 5 days graphs will be automatically drawn for the selected stock in the combo box.


Select a particular stock in the combo box to download the historical data. Else select the "Download All NSE scripts" checkbox to download the data for all the scripts listed in NSE

NOTE: Download all data will take around 15-20 mints and the UI will be frozen during that time.


The graph will be updated automatically when the user selects the particular script in the combo box. :)


Now select the from date.


Select the to date. Note that the ToDate always restricted till today's date.


If you want to store the .csv file in a particular folder then click on "Broswe" and select a folder.

And clicking on Download button will download the historical EOD data in .csv format.

this can be feed directly to MetaStock, AmiBroker etc


Happy trading :)

Comments and suggestions are always welcome :)

Warm regards
Manjunath G
manjunath.govindaraju@gmail.com

-----------------------------------------------------------------------------------------------

Update 1: (included Graph date range)

----------------------------------------------------------------------------------------------


Update time..... In this update, I provided radio buttons to select the graph period. Now graph is available for following time frame.

  • 1 day,
  • 5 days,
  • 3 months,
  • 6 months,
  • 1 year and
  • 2 years
NOTE: Displaying of graph is depends on your internet speed. In my machine the graph is available with in a second.

Download the latest software from

http://www.geocities.com/manjunath_govindaraju/YahooEODDownloader_1.1.zip


Screen shot is as follows.


Use the radio buttons to select the time frame


Warm regards
Manjunath G
manjunath.govindaraju@gmail.com
-----------------------------------------------------------------------------------------------

Update 2: (included all BSE scripts)

----------------------------------------------------------------------------------------------

Updated the software to incorporate all the BSE scripts along with the NSE scripts.

Now user will get a choice to select the two differenct exchanges ( ie BSE or NSE). When user select NSE, all the scripts listed in NSE exchange will be displayed in the combo box, similarly when user selects BSE, all the scripts listed in BSE exchanges will be displayed in the combo box(only BSE codes).

Download the latest software from

http://www.geocities.com/manjunath_govindaraju/YahooEODDownloader_2.0.zip

Screen shot is as follows:


NSE and BSE radio buttons are provided to select


Comments and suggestions are welcome.

Warm Regards
Manjunath G
manjunath.govindaraju@gmail.com

Wednesday, December 12, 2007

LIVE Interday data for Technical analysis


Hello All,

I think many people are intersted in learning technical analysis and this blog will really help a bit.

Wht is technical analysis?

"Technical analysis is the study of market action, primarily through the use of charts, for the purpose of forecasting future price trends." The basic requirement for technical analysis is "Chart". Chart is nothing but the representation of text data in a graphical way. So basically we need data to plot a chart.

Now my next question is where do we get these data?

There are plenty of websites which provides free EOD (End of Day) data to public. But I didnt find any place where we get free interday live data for technical analysis. If you know some place where we can get this for free, please do let me know.

So to overcome this problem (or to save money) I modified my small portfolio application (NSETicker) to extract the data from nseindia.com for every minute (this is configurable) and stores it in a file (.csv format ).


Each selected securities in the portfolio will be written in a seperate file and these files can be directed feed to Amibroker or any other software which supports CSV format for charting purpose

NOTE: This application is developed using C# and have the following restrictions.


1. .NET framework should be installed in the machine (.NET framework is available to download at free of cost from Microsoft website)

2. Now all operations are happening in a single thread. It means the application wll be bit slow and sometimes may not responds, that time just kill the application and restart it. The new values will be appended in to the .csv files. [I am working on creating seperate threads for each securites for faster access]


Please read my other blog http://manjunathg.blogspot.com/2007/06/nse-portfolio-ticker.html for the usage of the tool. The main changes will be expalined here.


Main UI

The values will be refreshed for every one minute ( and it is configurable). you can also refresh manually by clicking the "Refresh" button in the right bottom of the screen.


Following steps explains the usage/settings of saving the data in .CSV format.


Step 1:


Step 2:


Step 3:


So now onwards the data (ie .csv) file will be generated in the directory specified in the general settings. You can use this .csv file in any application to draw the graph :)

Enjoy :)


.CSV are stored in the specified location.


The content of the CSV is as follows.


LITL.csv

Date,Open,High,Low,Current,Volume
2007 Dec 12,696.75,768.4,660.2,753.85,5804603


(All data are same because I tested this off market hours ;))


Dowload link:
http://www.geocities.com/manjunath_govindaraju/NSETicker.zip


Please dont hesitate to give me the feedback, request, comments or suggestions. My eyes and ears are always open :)


warm regards
Manjunath G
manjunath.govindaraju@gmail.com

Monday, August 06, 2007

Bug fix for NSETicker

Hello All,

There was some problem in the NSETicker software. Thanks to those who reported me personally :)

Here comes the investigation report.

Problem:
NSETicker software does not work anymore.

Reason:
Nseindia.com changed the UI and pattren of displaying the stock information. Due to this the NSETicker was unable to pick the correct data.

Solution:
I Modified the code and fixed the problem. Now the software picks the correct data and displays it.

Due to this changes the performance has imporoved a lot :) Now the data loads bit faster :)

Download:
Download the latest software from the following link

http://www.geocities.com/manjunath_govindaraju/NSETicker_ver1.1.zip


In case any problems are imporvement please do let me know

warm regards
Manjunath G
Manjunath.Govindaraju@gmail.com
------------------------------------------------------------


Update 1: [29-March-2009 = 00::48 ]

After getting many request and suggestion, I modified the NSEFutureTicker software with the following changes.
1. Added all the scripts (in NSE) to the list ( For this, copy the attached ticker.txt file to c:\ )
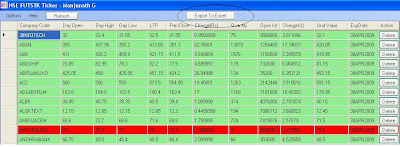
2. ExportToExcel - Added a new funcationality to transfer the data from the software to Excel sheet


Following is the screenshot of the new software.


Clicking on "Export To Excel" will open a excel sheet with captured data.

Download the latest software from the following link 


warm regards
Manjunath G
Manjunath.Govindaraju@gmail.com

Tuesday, June 19, 2007

NSE Portfolio Ticker

Dear Friends,

After getting the comments, suggestions and appreciation on NSEGrabber, I was motivated to write another software for the benefit of investors/traders. This new software called "NSETicker".

Its a grid type software, in which you can add all your favourite NSE stocks and the data will be updated automatically after every specified time. After adding the stocks this software shows the following informations.

1. Company code.
2. Previou's day close.
3. Last Trade price.
4. Today's change (Rs).
5. Today's change (%).
6. Volume.
7. Day's High.
8. Day's Low.


Following are the major features available in this software.

1. Add your favourite stocks.
2. Save the portfolio and user settings.
3. Proxy setting.
4. Refresh Interval time settings ( the stock information will be updated every specified interval )
5. Delete the particular stock.
6. Ticker updates the value only during market hours (10am to 4 pm). saving of bandwidth during non-market hours.


Now let me explain about the usage of this tiny software.


First Screen:
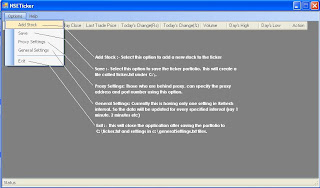
As soon as you double click on application for the first time you will see a window like this. There is menu called "Options". Using this you can add your fav stocks, save the portfolio, general settings, proxy settings and Exit. Clicking on "Options" will show the different entries like in the below image.


Main Screen:
  • Add Stock : Using this user can add new stocks to the portfolio.
  • Save: Save the portfolio in to harddisk. here a file called ticker.txt will be created in c:\
  • Proxy settings: user can change the proxy settings using this option.
  • General settings: curretnly only refresh interval can be modify using this. by default, the refresh interval is 1 mints ( and its the minimum).


Add Stock:

By clicking on Options->Add stock, will pop up another window like this. In the combobox you can select which ever company code you want and click on "Done".


Main window with rows:
Clicking on Done will extract the data from the nseindia.com and displays the information in the row wise.
Delete option will be enabled after adding any new row and using this user can delete the specific row.


Proxy Settings:


This feature will be used for those who are behind proxy server. People like me who sits in office behind proxy server can specify the proxy address and port number and click on Ok.

This is required to extract the live data from NSEindia.com


General Settings:


Using this user can specify the refresh interval time. By default, the value is 1 mint( this is the minimum).
After every specified interval the data will be again updated with nseindia.com.


Main menu with all ur fav stocks
This is how it looks after adding all your favourite stocks .


Save:


User can save the portfolio by using Options->Save. By doing so the portfolio will be saved in the harddisk and the status message will be displayed saying "Saved the portfolio succesfully".


Refresh:


After the specified time of interval the data will be updated and the message will be displayed in the status bar like "Last updated on ...."

Btw, the data will be updated only during market hours. ie between 10am and 4pm. Due to this the software will not use any bandwidth during the non-market hours ( any way the data will be static after market hours)


Comments, suggestion, appreciation and criticism.

As usual source code will be provided for the interested people. :)
warm regards
Manjunath G
manjunath.govindaraju@gmail.com

------------------------------------------------------------------------------------------------------------
Update 1:

Followng are the changes in the latest version.
  • Color Indication added.
    Red - Negative
    Green - Positive
    White - No changes
  • "Refresh" button added for manual reset (if you dont want to wait for specified time and wants the update immedietly)
  • Improved the status messages.
  • Fixed small bug ( before refresh was happening on ly between 11am and 4pm and now changed to 10am)
Download the latest version from www.manjunathg.com/NSETicker.exe
warm regards
Manjunath G

------------------------------------------------------------------------------------------------------------
Source Code:


Interested people contact me for the source code.

regards
Manjunath G
Manjunath.govindaraju@gmail.com


Friday, June 01, 2007

NSEGrabber

Hi All,


I met a guy called Pulkit kumar in an orkut community and by his inspiration/requirements I developed a small application called NSEGrabber. This is the small application which gets the stock quotes online from http://www.nseindia.com. The main UI of the application looks like this...


The zip file contains the following three files. download here

1. NSEGrabber.exe - Main application

2. AxInterop.SHDocVw.dll - .Net dll for graph

3. Interop.SHDocVw.dll - .Net dll for graph


Usage:

1. Double click on the NSEGrabber.exe
2. In the main menu ( shown above ) select a particular company code in the combo box.


3. Selecting a company code will show the last traded price, previous day close, trade quantity and change in percentage.

4. You can view the today's graph by clicking on "View Graph" button.


NOTE: This application was developed using C# language and to use this the user should have .NET framework and jvm (for graph) installed in their machine.

.NET framework can be downloaded from http://www.microsoft.com/downloads/details.aspx?familyid=10CC340B-F857-4A14-83F5-25634C3BF043&displaylang=en (size 2.8 MB)

Guys,


If you need any updates or any improvement plz do let me know. I can do and update you with the new patchs. I can also provide the source code for the interested people.

Courtesy: special thanks to www.nseindia.com for providing me the required information.


Manjunath G
Manjunath.Govindaraju@gmail.com


Update 1: with proxy settings


I added the proxy settings requirement so that the people behind proxy server can specify their proxy address. The new UI looks like..


Dowload the latest software here (85KB)


Update 2: With Today's High and Today's Low


As per the request from Mr.Rajeev, I added the Day's High and Day's Low in to our tiny application... Download the latest softeare here (86KB)

Source Code :

Finally I got some time to clean the code and update to internet. Please download the source code @ http://www.geocities.com/manjunath_govindaraju/NSEGrabber_SC.zip

Tuesday, April 17, 2007

Preventative Medicine Is Hard to Sell

This article is written by Clarke Ching

The last time I did something truly clever was in late 1996. I solved a problem that previously had seemed impossible to solve. Yet I found the solution to the problem in thirty minutes, while working on another project. I was very pleased with myself.

At the time I was the technical lead of a development team in a medium-sized bank, which had just been bought by a larger bank. The key motivation for the merger was the cost savings: Together we could serve the same number of customers using fewer branches and head office staff. Another major cost saving was that the smaller bank’s IT systems could be switched off, the excess hardware sold, and many staff laid off as well. My team was working on one of the migration projects.

In the early stages of the migration, I discovered a major technical problem. During the period when the bank was planning to close branches, more than half a million customers would have to visit their local branches in order to key in new security PIN numbers. Because the customer’s card number would change during the migration and the debit and credit card PINs were encrypted using the card number as one of the encryption keys, the new PINs would not work on the new cards. These "technical complications" were well known throughout the banking industry.

I discovered a very simple way of overcoming this problem, unexpectedly, while reading some very dense technical documentation for an unrelated project. It was one of those light bulb moments you see in cartoons. Within thirty minutes, I had documented the solution and "proved" it in theory with my colleagues, but it still needed to be proved with an experiment. I spent another hour or so polishing a memo describing my solution before sending it off to . . . well, that was my next problem. Who should I send the "solution" to?

Being in my mid-20s at the time and full of technical strength coupled with an unhealthy dose of confidence and naïvety, I sent my memo straight to the program manager of the IT migration project. I had been careful—as I'd been taught to do—to send him not only a problem but also a solution. I sat back and waited for my email to ricochet around the organization and for the plaudits to rain down on me. And, sure enough, a few minutes after hitting the send button my PC chimed, indicating a new email had arrived. The program manager replied with a simple "Thanks!"

Still, I waited for the plaudits. And waited. But nothing happened. After a week of pressing the refresh button on my email software every five minutes, I rang the program manager to check how things were going. He listened politely to my query, said he couldn't remember my email, but promised to look into it.

I was stunned by his lack of interest. I knew he was a busy man, but my memo clearly indicated that this project had a small cost—less than a month’s work for one person—and a big benefit. The branch closures could happen sooner, and the bank could save millions. Three weeks later, after no response from the program manager, I called him again. He thanked me and told me that he looked into my memo but that the decision had been made not to pursue the issue any further. Hmm, I thought. So I fired up my email client, printed the original email, and headed toward the cards department. They, after all, were the people causing the problem. Somehow I managed to bump into the head of the cards division just as she was leaving the office for the day. I cornered her, explained the situation, and gave her a copy of my memo. She said, "That sounds very important," thanked me, and promised that one of her project managers would contact me. And one did, the very next day. He, too, agreed that this was a big problem, thanked me, and said he'd get onto it.


I left that day pleased that my perseverance had paid off. But nothing happened. A couple of weeks later I received an email from the credit cards project manager thanking me for my input and saying that for now they had decided to drop the project due to "resource issues."

By now I had grown weary of my little project. It was time to give up. Why should I care, I rationalized, when older and wiser people obviously don't. It isn't my problem, I consoled myself. The problem isn't causing me any pain. If they're idiots . . . well, so be it.

It was then, of course, that I realized that I was the idiot, not them. I had presented the problem and solution to people who—just like me—didn't suffer due to the problem. My email to the IT program manager just landed him with more work. It was the same with the head of credit cards. It slowly dawned on me that the people who should be informed were the ones in charge of the branch closures. They were the ones who would suffer from the problem. So I talked to them. Surely, I figured, it was easier to sell aspirin to someone with a headache.

The folks in charge of the branch closures were reluctant to talk to me at first. But once they got past the techie jargon and recognized that this was a serious problem that would hinder them from achieving their goals, they became enthusiastic. My idea—or a variation on it—was implemented quickly and seamlessly.

A decade later, I still remember the valuable lesson I learned from this event. We techies can achieve more if we apply a little common sense and basic marketing skills to our problem-solving approaches. And don't be discouraged if the only time anyone thanks you for your idea is when they're politely dismissing it.

Author: Clarke Ching (www.clarkeching.com)
copied from :
http://www.stickyminds.com/s.asp?F=S12193_ART_2